


A break-even analysis is a calculation to help a business discover how many units, items, or services you need to sell before your business starts making a profit. Break even analysis calculations are important for:
- Creating a business plan and pitching for financing or investors.
- Making product and pricing decisions.
- Evaluating investment opportunities for your existing business.
The difference between a break even analysis and a break even point is that the break even point is where your total revenue equals your total costs, so you come out exactly even with no loss or gain, and the break even analysis is the calculation to find this data point.
Both matter because once you know how to calculate your break even point using the break even analysis formula, you can begin controlling your profitability, allowing you to expand your business, attract investors, and know when you’ll have enough money to replace or upgrade equipment.
Below, you’ll learn how to do a break even analysis to find your break even point, when these items are important for making business decisions, and how to set up a spreadsheet in excel with step-by-step instructions for creating a break even point calculator.
How to Do a Break Even Analysis
A break even analysis finds the break even point where you have sold enough units to cover all business costs so that anything above this point adds to your profit. Here is the formula to calculate it:
- Break Even Point (BEP) = Total Fixed Costs / Gross Profit per Unit (GPU)
Here is the 3-step process to do a break even analysis:
- Gather your business data.
- Calculate your Gross Profit per Unit.
- Calculate your Break Even Point.
Now that you have the formula and steps, here’s where to find the information and how to modify the formula to match your specific situation. At the end of the post, we share how to build a break even analysis calculator if you want to quickly and easily calculate your break even point.
Gather Your Business Data
Start by gathering the following data to do a break even analysis.
- Price per Unit: This is the amount you charge for each item/service you sell or plan to sell.
- Cost per Unit: For new business plans, sum up the expenses directly linked to the thing you sell, like raw materials or manufacturing labor costs. Then divide this by the total number of units you plan to sell. If you have historical financial records, divide Cost of Goods Sold from your income statement by total units sold for the year.
- Total Fixed Costs:
- Use all your business expenses that aren’t directly linked to your cost of goods sold when doing a break even analysis for your entire business, like when you are creating a business plan. For existing businesses, this would be the sum of all lines on your income statement beneath the Cost of Goods Sold line.
- When doing a break even analysis for an investment, total fixed costs will be the new costs directly related to the investment.
Calculate Your Gross Profit per Unit
Once you have your data, calculate the Gross Profit per Unit (also known as the contribution margin), so you can figure out how many units you need to sell to cover the rest of your expenses.
- Gross Profit per Unit (GPU) = Price per Unit – Cost per Unit
Calculate Your Break Even Point
The final step in a break even analysis is to use this formula to find the break even point, which is the point where each additional unit you sell adds to profit.
- Break Even Point (BEP) = Total Fixed Costs / Gross Profit per Unit (GPU)
Once you find the BEP, you’ll know how many units or services you need to sell to “break even,” or get to a net profit of $0. Anything above the break even point adds to your profit. This is why it is an important analysis to complete in order to make product and pricing decisions, as well as why it’s important to include in your business plans when you’re applying for small business loans or attracting investors.
When a Break Even Analysis Is Important
Because a break even analysis shows the point where your business or investment starts to exceed total cost and become profitable, it’s an important analysis for 5 key events:
- Creating a business plan and pitching for financing or investors
- Making product and pricing decisions
- Evaluating investment opportunities for your existing business
- Knowing which parts of your operations impact profitability, so you can optimize your costs and expenses (also known as a sensitivity analysis)
- Having a margin of safety (the difference between your break even point and additional sales, which gives you a financial safety net), so you can modify your sales and marketing strategies over the course of time to keep your business profitable
Here’s how this applies to different situations, as well as scenarios you may experience as a business owner.
Creating a Business Plan and Pitching for Financing
Whether you’re pitching private investors, asking friends and family for startup funds, or seeking a bank loan, a break even analysis in your business plan is important to show potential financing providers the point where you start to turn a profit (and prove that this point is achievable).
An example would be for a new bike shop that needs to sell 10,000 bicycles each year to break even. They need to match this number with market data to show that it is possible to exceed this break even point.
If there are 20,000 people in the shop’s town, it would be nearly impossible to sell 10,000 bicycles every year, since the average lifespan of a bicycle is much more than two years. Unless their plan includes additional sales channels like a significant e-commerce presence, they would be unlikely to turn a profit.
Making Product and Pricing Decisions
A break even analysis can help you compare different product and pricing options, like creating a business plan for a pasta food truck and needing to decide between noodle and sauce options for the first dishes.
The cost of the food truck, labor, cooking utensils, etc. remains the same, but you have to decide between providing a pricy bucatini bolognese or a simple capellini marinara.
The bolognese requires more ingredients and more steps to cook, so the cost would be higher per dish. But since the bolognese sauce has meat, you can charge more. A break even analysis helps you understand when you’ll start turning a profit for each scenario:
| Bucatini Bolognese | Capellini Marinara | |
| Price Per Plate | $14 | $9 |
| Cost Per Plate | $5 | $2.5 |
| Gross Profit Per Plate | $9 | $6.5 |
| Total Fixed Costs | $200,000 | $200,000 |
| Break Even Point | 22,300 | 30,800 |
You will need to sell about 38% more plates of marinara over the bolognese to break even, so if your market is heavily skewed with meat eaters, the bolognese is an easy choice given the beefy sauce. As customers ask which one they should choose, you know it’s a good financial move to push the bolognese more heavily.
Most businesses don’t sell a single product though, so you can do a break even analysis for a mix of products by using a percentage for each item’s gross profit per unit.
If you do a market research survey for the food truck above and find that 40% of the market would order the marinara, here’s how your break even analysis will work with the break even point formula modified for a mix of products instead of a single item:
- BEP = Total Fixed Costs / (Percentage 1 x GPU for Product 1 + Percentage 2 x GPU for Product 2)
- BEP = $200,000 / (60% x $9 + 40% x $6.5) = 25,000
If you sell both dishes where 60% are bucatini bolognese and 40% are capellini marinara, you need to sell 25,000 plates total to break even vs 22,300 if you only sold bucatini or 30,800 selling just the marinara.
Evaluating Investment Opportunities for Your Existing Business
Break even analyses are also important to make sure you can cover the costs of a new investment, especially if you’re applying for a business loan. This shows the lender you can pay them back.
If your Italian food truck from above gets rave reviews on one of the sauces, you may decide to bottle it, as there is demand. Now you go to market and get an initial deal with the local grocery chain for 1,000 bottles per month.
This is when you do a break even analysis to find out if it’s enough to cover the $10,000 of personal or business savings you’ll use for labor, rent, and other expenses, plus the equipment financing loan (we’ll use $50,000 for this example) that you’ll need to begin production:
| Pasta Sauce | |
| Price Per Bottle | $4 |
| Cost Per Bottle | $2 |
| Gross Profit Per Bottle | $2 |
| Total Fixed Costs (Personal Investment + Equipment Loan) | $60,000 |
| Break Even Point | 30,000 |
Since the grocery chain promised to order 1,000 bottles per month and you need to sell 30,000 bottles to break even on the investment, it will take 2.5 years before you start to make a profit.
If you don’t need the profit to live on during this time and don’t have to repay the full loan beforehand, this might be an option. But a better idea would be to get additional customer commitments or cost reductions before locking in the loan.
To decide what’s best, do a sensitivity analysis to see how changes in your numbers impact the break even point, like how cutting $5,000 with cheaper labor and rent compares to charging an extra quarter per bottle. Here’s how this would look compared to your original break even analysis:
| Original | Lower Fixed Cost | Higher Price | |
| Price Per Bottle | $4 | $4 | $4.25 |
| Cost Per Bottle | $2 | $2 | $2 |
| Gross Profit Per Bottle | $2 | $2 | $2.25 |
| Total Fixed Costs (Personal Investment + Equipment Loan) | $60,000 | $55,000 | $60,000 |
| Break Even Point | 30,000 | 27,500 | 26,667 |
The higher price gives you the lowest break even point of the 3 options. If customers will pay this higher price, you’ll be better off than trying to cut fixed costs.
How to Create a Break Even Analysis Calculator
To create a break even analysis calculator, you’ll need a spreadsheet software system like Excel or Google Sheets. We’re going to use Excel for this example.
Start by entering your data point labels in column A and enter the values in column B like in this example:
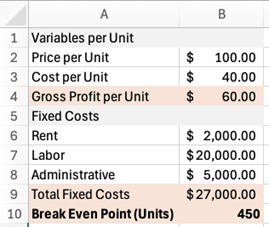
The formulas for cells B4, B9, and B10 are in the table below. Make sure to adjust the excel formula for Total Fixed Costs if you have more or fewer fixed costs:
| Data Point | General Formula | Excel Formula |
| Gross Profit per Unit (GPU) | Price per Unit – Cost per Unit | =B2-B3 |
| Total Fixed Costs | Sum of all fixed costs | =sum(B6:B8) |
| Break Even Point (Units) | Total Fixed Costs / GPU | =B9/B4 |
Step-by-Step Instructions for a Break Even Chart in Excel
Now that you know your break even point, you can add visual appeal to any presentation by making a break even chart in excel that shows how your profit grows as you continue to sell more units.
Start by creating a 2-column table with Units in column A and Net Profit in column B. For units, start with fewer than your break even point and continue past it. Since the BEP is 450 in this example, let’s use 50 unit steps from 50 to 900. The formula to calculate Net Profit is:
- Net Profit = Units from column A x Gross Profit per Unit – Total Fixed Costs
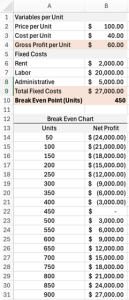
Note: In the formula below, “A14” refers to the first value under Units in column A. $B$4 refers to the Gross Profit per Unit. $B$9 refers to the Total Fixed Costs value. The “$” in front of the column letter and row number tells Excel not to change which cell the formula refers to when you paste the formula into the cells under “Net Profit.” But since we do want Excel to use the different Unit values for A15, A16, etc., we don’t use the “$” in front of that element.
| Data Point | Excel Formulas |
| Net Profit | =A14*$B$4-$B$9 |
Once you have the table created, follow these steps to create a break even chart highlighting your BEP. Depending on your version of Excel, the images might appear slightly different:
- Choose the Insert Menu > Chart > Line
- Choose Select Data from the Chart Design menu
- Click in the Chart Data Range box
- Highlight “Net Profit” and the numbers underneath
- Click in the Horizontal (Category) axis labels box
- Highlight the numbers under “Units” (don’t highlight the word “Units”)
- Click OK. Then your chart should look like this:
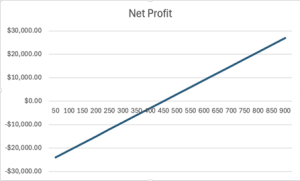
Bonus Tip: If your chart has a “$-” instead of “$0.00,” highlight the numbers under “Net Profit” in your spreadsheet and change the number format to “Currency.”
- Click on “Net Profit” in the chart. Then double click to change it to “Break Even Chart (Net Profit by Total Units).”
- Right click on a number in the X-axis and choose “Format Axis.” Click directly on the number, not in the white space between numbers. The menu will pop up to the right of your spreadsheet.
- Under “Axis position,” choose “On tick marks.”
- Under “Tick Marks” change “Major type” to “Cross.”
- Right click on the blue line and choose Format Data Series
- Under “Marker Options,” choose the “Built-in” type and size you prefer
- Right click on your break even point on the line where it crosses the X-axis and choose “Format Data Point”
- Under “Marker Options,” change the size to 10. Under “Fill,” change the color to green
You now have a break even chart with the break even point highlighted and ready for any business plan or presentation!
By doing a break even analysis for new business plans and for potential investors, you’ll know how much you need to sell to cover all the costs in your business. You can match this number with market research to attract investors and prove to creditors how the market demand exceeds your break even point. You can also show them how soon you’ll start to make a handsome profit.

