


With the right prompts and data uploaded, AI tools like Claude and ChatGPT can help you know:
- When you’ll likely need to start discounting products to make room for the next season or line.
- What inventory to avoid ordering because it never fully clears, including variations like flavors, sizes, and colors.
- How much to order vs. guessing when it comes to trendy products vs. staples.
This can save you hours of time trying to analyze data and locate trends. It’s as easy as exporting data from a few past seasons and asking for the correct output. With the right prompt, you’ll be able to get recommendations to help you maximize your revenue from merchandising.
This can work for auto body shops that need to refresh refrigerants for the summer and antifreeze for winter; candy retailers that order candy canes and peppermints in winter with fruit-flavored gum and lollipops for summer; and beach town clothing stores that need hoodies for the early and end of season and flip flops in the middle. With the right modification, you can even have it help decide what to order more or less of to keep up with customer demand and increase your profits.
Here are prompts for each of the three scenarios above, which you can modify to fit your products and inventory.
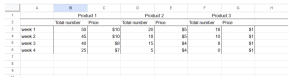
Before you begin, when we reference a column with two sub-cells for your spreadsheet, it should look similar to this. Columns B and C equal one column for a specific product and there are sub-columns for the total number of products and the price per unit at that time. Week 1, 2, 3, etc. can be the dates of the week or however you track weeks in your business.
Scenario 1: AI Prompts to Start Clearing Products and Make Shelf Space
AI can help you estimate when you’ll need to start clearing shelf space to make room for next season’s lines, or as new inventory comes in from a pre-order. This way you can begin moving products via discounts, shifting displays to more prominent areas, or by creating bundles.
The prompt below works best for seasonality including holiday shopping, calendar seasons, and if products get a new release on a regular schedule.
The system is going to need the following in a spreadsheet or inventory report:
- Inventory levels for products by month for the season and two months before (i.e. if it is to make space for Q4 holidays, upload from August to December)
- The SKUs that you always have and need to clear with the inventory levels for each of the months.
- How much each item costs per unit on average by month so the system knows when you begin discounting items to clear them.
The prompt to fill out with your information:
“Please look at the data in the attached spreadsheet where I have the months from August to December in the columns with the year for the last five years. The rows are the SKUs I sell.
Each column has two sub-cells below it which represent the amount of inventory left at the end of the month and the average price per unit. In August and September you’ll see the price remains the same as this is the peak-price season for the product.
Afterwards I need to clear inventory so the price per unit goes down as I begin discounting. The progression in price and quantity shows how quickly I moved the product over the last five years in each month. It also shows when I began discounting to clear shelf space.
I need to know when you would recommend beginning to discount each SKU in the sheet so I can clear most of the inventory by the middle of November to make room for new products. The goal is to have at least 25% less at the end of October and 50% less by the end of November as it barely moves in December.”
Pro-tip: If you can do this by week, the output from the AI system may be even better as it can get more granular.
Scenario 2: Knowing What Inventory to Avoid Ordering, or Order Less Of
Everyone orders a product or variant because they love it. Then each year we remember it never fully sells, so we discount, liquidate, or use it as a free gift with purchase. AI can help you know which products or variations to order less of, or which to avoid because they never move.
This includes avoiding green hair ties but doubling up on black and neutral tones, or a specific type of windshield wiper fluid that never sells while ordering ⅓ more of a secondary brand which also has higher margins. This also applies to t-shirts by size, or seasonal flavors like pumpkin spice and lavender used in desserts.
With the right modifications to the prompt below, the AI system can even help estimate your profits by including your margins by item sold to get an even better mix of how many of each to order.
The system is going to need the following in a spreadsheet or inventory report:
- The products and variants.
- How many are left in stock by date in either weeks or months (weeks is better) for the past 3 or 5 years.
- Optional — The price point for each if you split the in-stock number into two sub-cells for each column.
The prompt to fill out with your information:
“Please use the attached spreadsheet where the columns are the weeks/months and the rows are the products with their variations. The first column for each year shows my total number of products ordered by SKU. The cells are how many products I have left in inventory by week/month.
I’d like you to help me adjust my ordering so I place the right amount for the following:
- How many of each SKU should I order this year to make sure I have less than XYZ in stock by (insert week/month here)?
- Which SKUs should I consider not ordering because they move the slowest, or how many fewer should I order to keep me with less than 20% in stock by (insert week/month here)?
- Are there any SKUs I should consider ordering more of because they always sell out the fastest?”
Scenario 3: When to Start Discounting
We all hate sacrificing margin, but inventory needs to move. By having AI analyze when you normally begin reducing prices, you can test other ways to move products that reduce margin by 10% instead of a 20% off deal.
It could be a bundle with complementary products, buy 2 and save 15% on the third if people normally buy two in a single purchase, or move them to a better location in your shop or ecommerce store so people are more likely to see them and add them to their cart.
The system is going to need the following in a spreadsheet or inventory report:
- The total products in stock
- The SKUs
- The price per product
- The weeks or months over a period of time
The prompt to fill out with your information:
“Please use the data from the spreadsheet I uploaded that has the SKUs in the columns and the weeks with dates in the rows for the last XYZ years. In each column are two sub-cells that have the price per product and the total products in stock. My goal is to avoid discounting products and you’ll be able to see when I start by SKU because the total price per product begins reducing.
Please create a bulleted list for each SKU that recommends which date range I should begin trying to move each SKU more aggressively, and roughly two weeks before I would normally begin discounting.”
AI can help you with merchandising including knowing how many units to order, when to begin discounting or testing less costly methods of moving product, and which products you should order more or less of. Customer demand can always change, but AI can help you make an educated decision by using your past data within seconds so you don’t have to spend hours analyzing the spreadsheets yourself.
National Funding does not provide tax, legal or accounting advice. This material has been prepared for informational purposes only. You should consult your own tax, legal and accounting advisors.

